
The Use of Graphics to Inform or Misinform During the COVID-19 Pandemic
By Lauren Belus
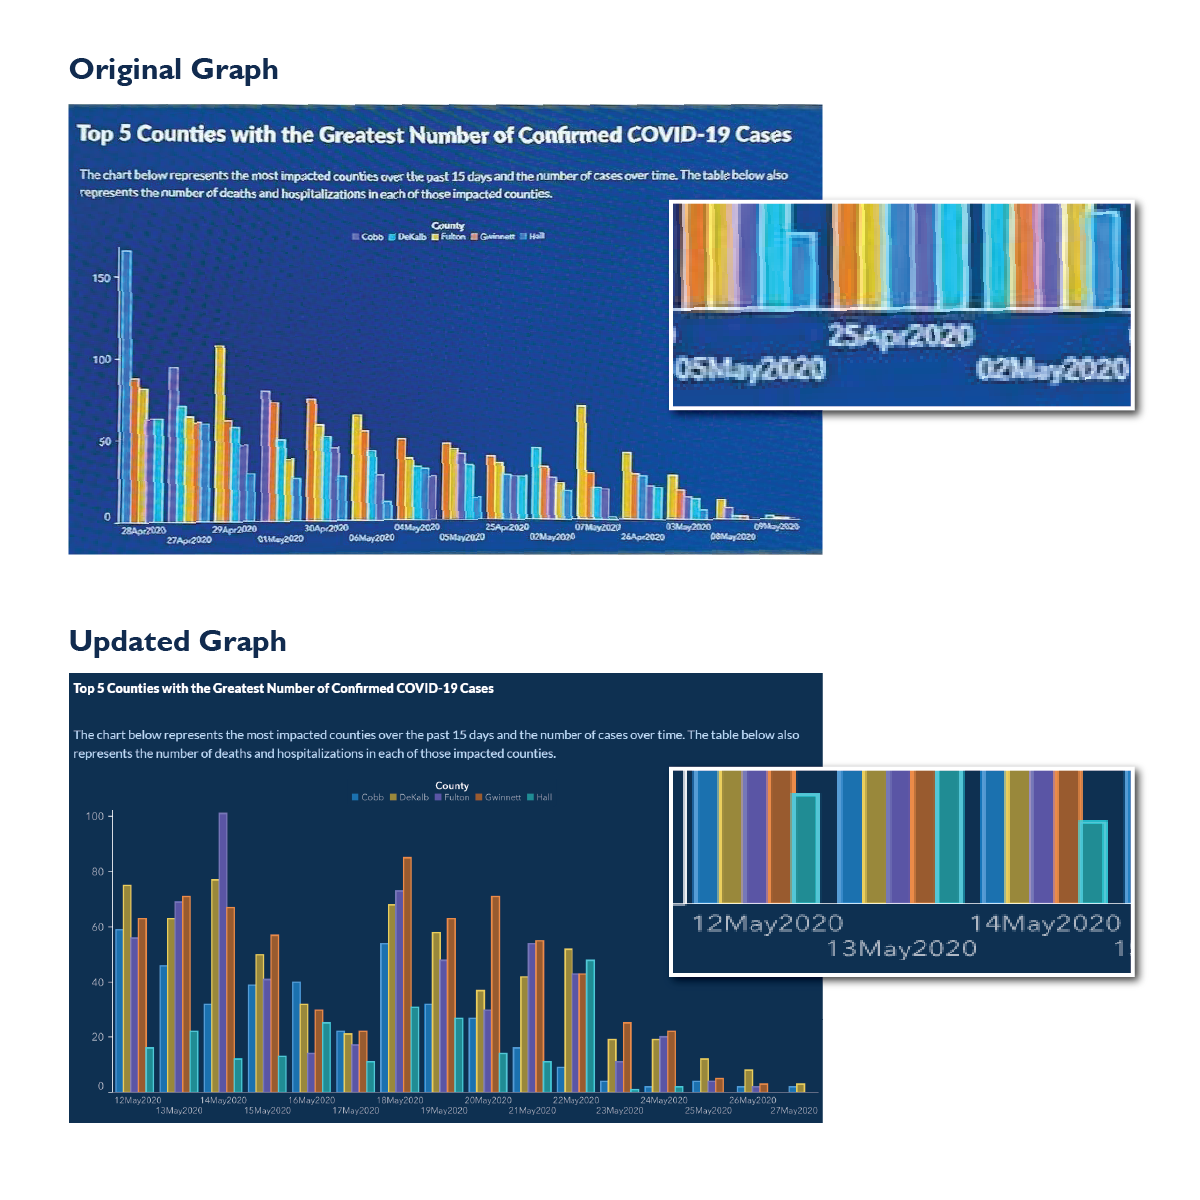
The purpose of graphs and charts are to easily inform the general public on pertinent data. But what happens when the visual represents the data in a way that confuses or misinforms? Below is a graphic published by Georgia’s Department of Public Health, showing COVID-19 cases ranked by county. After publishing this graphic, the Department received a wave of negative feedback that was picked up by the national media.
Many observers believed that the data was plotted in a manner intended to give to the public the impression of a smooth downward trend of confirmed cases over time. In order to create that impression, the dates along the x-axis did not appear in chronological order. In addition, the order of plotted counties changed from day to day, making it very difficult to track a specific county through the date range.
After much criticism, the Department published an updated chart. In the new version, the chronology of the dates was revised to be sequential and the groupings of bars per county were made consistent for each plotted date. The updated chart still shows a downward trend; however, it is not as dramatic or as consistent as in the one originally published. This revised version removes the grounds for the criticism about the information being misleading.
Designers make strategic design decisions when creating demonstrative evidence, which can influence the perception of the data and add credibility to attorneys’ themes and arguments. However, when a demonstrative is proven to misrepresent, it can be used against the presenter to compromise credibility in the eyes of the jury. The image might be disallowed by the court as overly prejudicial. When plotting data for a demonstrative, it is important not only that the data be accurate, but that the visual representation of the data be accurate as well. Design decisions like these will ultimately determine the success of your demonstrative at hearings and trial.
